Automated Daily/Monthly Active User Stats in Google Data Studio
Google Analytics provides information on Daily Active Users (“1 Day Active Users”) and Monthly Active Users (I typically use “28 Day Active Users” since the end-users for the products I’m working on tend to have a strong weekly activity cycle). This is good data to have, but I had a few improvements I wanted to put in place:
View the same info in Google Data Studio so I can display it in an embedded report
Show the report viewer the DAU/MAU ratio (a popular metric for product “stickiness”)
Show the report viewer average DAU and MAU stats
Here's what it might look like (this report compares made-up data from two products):

Google has made some of this easy to do, and some of it is less easy...but the entire thing is automatable.
PREAMBLE
For this guide to make sense, ideally you should be familiar with Google Analytics and Google Data Studio. It would also be good to run through “Automated Access to Google Analytics Data in Google Sheets” (https://developers.google.com/analytics/solutions/articles/reporting-apps-script) as the principles used there will be used in this guide.
This guide does use the Google Analytics API so you will need to be able to set up API access for the Google Analytics view your data is in. The permissions for giving a Google Apps Script access to your data are fairly broad so you should make sure to review the script provided here so you can be confident your data isn’t going to be mishandled.
Also, for brevity, I'm using "DAU" for "Daily Active Users" and "MAU" for "Monthly Active Users" throughout. Again, where I use "Monthly Active Users" or "MAU" I'm referring to "28 Day Active Users" specifically.
I. DAU AND MAU IN DATA STUDIO
In this guide we’re going to connect Google Analytics and Google Sheets as data sources for the report in Google Data Studio. Details on how to add data sources can be found in Google's guide here (https://support.google.com/datastudio/answer/6295036?hl=en) for Google Analytics and here (https://support.google.com/datastudio/answer/6295223?hl=en) for Google Sheets. With our Google Analytics data source set up, we can create time charts for our report.

To set up the time charts, we’ll start by creating one from the selected Google Analytics data source. The default metric selected will be Sessions (as seen above), so to see the Daily Active Users over time we just need to click on the metric "Sessions" and update the metric to "1 Day Active Users". Using the search bar in the metrics picker helps for this.

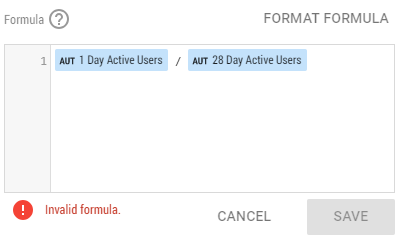
Normally, for a time chart, you’d add additional metrics to a single chart to see them all side by side. However, a single chart can’t have both “1 Day Active Users” and “28 Day Active Users” — if you try this you’ll get an error.

Instead, create a second time chart for the metric “28 Day Active Users”. Select both charts, right-click and choose “Blend Data”. This will output a single chart with both metrics displayed.
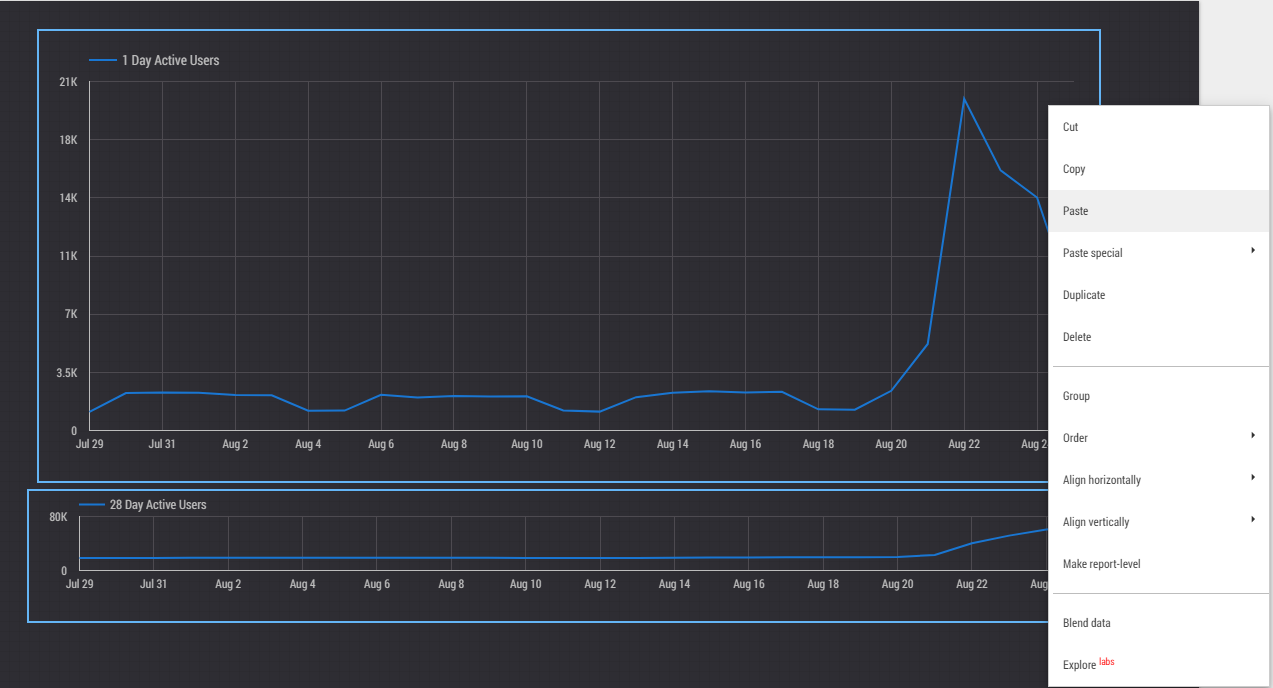

Do note that the data source for the joint graph is no longer the original Google Analytics view but a new data source called “Blended Data”. If you need to filter or segment the data (for instance, if you have a required login and you only care about sessions by users who passed authentication), you will need to do that on the original charts before blending the data. If the new chart is set up how you want, you can delete the original source charts. If you're making changes, delete the blended chart, update the two original source charts, and re-blend them. At the time of writing, blending works with up to five sources.
The “Blend Data” option is appreciably more complex than described here, for the purposes of this guide we’re just going to combine existing charts rather than merge entire data sources.
II. PREPARING TO SYNC DATA TO GOOGLE SHEETS
At this point, if we try to make any of the other charts we want for this dashboard in Data Studio, we may run into some issues:

It’s not possible to make a calculated metric for the DAU/MAU ratio.
It’s also not possible to get a "scorecard" of average DAU or average MAU.
The issue is with “aggregated” metrics from Google Analytics—metrics of this type generally can’t have anything interesting happen around them, they’re just reportable with the fixed aggregation type set by Google Analytics. This can be seen by checking the text in the left part of the blue Metric line -- "AUT" indicates an automatically aggregated metric.
In order to get the Daily/Monthly Active User info in a format we can work with, we will need to transfer the data from Google Analytics into Google Sheets. Google Analytics has a manual export option which creates a new Google Sheets document, but our report won’t be useful unless it automatically has the latest information — a manual update won’t cut it. Fortunately, Google Sheets has support for Google Apps Script and we can use some JavaScript to get the info we want into a spreadsheet.
We’ll take a look at the code shortly, but first we need to set up a script file and connect it to Google’s APIs.
Create a new Google Sheets document and name the document and the initial sheet informatively (you’ll need to locate it in Google Data Studio later). Use the Tools menu to open the Script Editor. This should give you a tab with an empty file called “code.gs”.

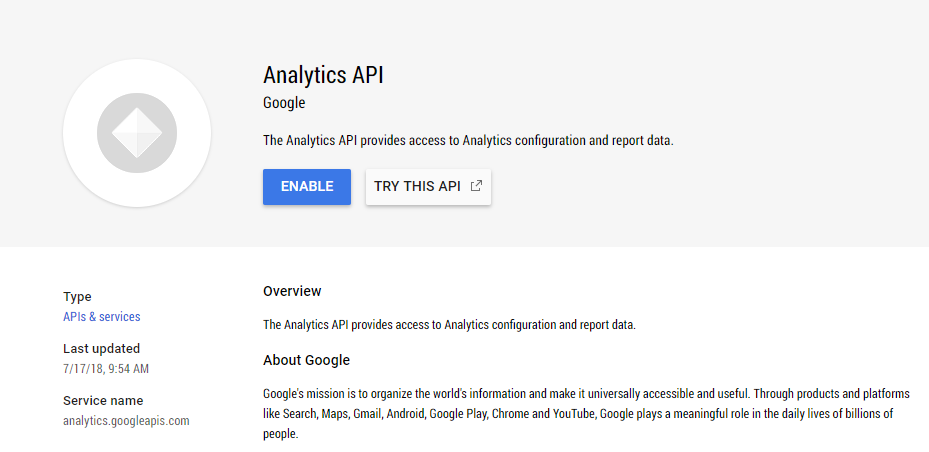
We’ll put our reporting script in here, but the script needs access to the Google Analytics API to work, so that should be set up first. Open Resources and select “Advanced Google Services” – in the area that appears, switch the Google Analytics API to “On”.

You’ll see a link saying this needs to be enabled in the Google API Console – follow that link, view all the applicable APIs, and switch the Google Analytics API to “On”. This guide was developed using the Google Analytics API v3 so it’s best to use that version. Using the Google Analytics Reporting API or API v4 may cause issues for you. With the API enabled in both locations, you’re ready to add and run the script.
III. THE REPORTING SCRIPT
The following script uses details introduced in Google’s script guide here (https://developers.google.com/analytics/solutions/articles/reporting-apps-script) and the spreadsheet library used is documented here (https://developers.google.com/apps-script/reference/spreadsheet/).
To set this up, start by finding the View ID number for the Google Analytics View you’re pulling data from. In Google Analytics’ admin section, this is in the View Settings area. You will need to update the value of googleAnalyticsView in the script to use your view ID.
Updated Feb. 2020 - “results” was not defined due to a missing line - this should now be fixed. Thanks to Henry Pray for the report.
function pullData() {
  try {
    var googleAnalyticsView = FIXME; // !!Set your GA View ID here!!
    var results = getReportDataForProfile(googleAnalyticsView,'ga:sessions,ga:1dayUsers');
    var secondaryResults = getReportDataForProfile(googleAnalyticsView, 'ga:sessions,ga:28dayUsers');


    outputToSpreadsheet(results,secondaryResults);
  } catch(error) {
    Browser.msgBox(error.message); // Note that the error is thrown inside your Google Sheets tab, not your Google Apps Script tab.
  }
}


function getReportDataForProfile(googleAnalyticsView,metricsList) {

  var profileId = googleAnalyticsView;
  var tableId = 'ga:' + profileId;
  var startDate = getLastNdays(56);
  var endDate = getLastNdays(1);

  var optArgs = {
    'dimensions': 'ga:date',
    'sort': '-ga:date',
    'start-index': '1',
'max-results': '250'
  };

  var results = Analytics.Data.Ga.get(
    tableId, startDate, endDate, metricsList, optArgs);


  if (results.getRows()) {
    return results;

  } else {
    throw new Error('GA view was not found, please check View ID');
  }
}

function getLastNdays(nDaysAgo) {
  var today = new Date();
  var before = new Date();
  before.setDate(today.getDate() - nDaysAgo);
  return Utilities.formatDate(before, 'GMT', 'yyyy-MM-dd');
}

function outputToSpreadsheet(results,secondaryResults) {
  var sheet = SpreadsheetApp.getActiveSheet();
  var headerNames = [];
  for (var i = 0, header; header = results.getColumnHeaders()[i]; ++i) {
    headerNames.push(header.getName());
  }
  sheet.getRange(1, 1, 1, headerNames.length)
      .setValues([headerNames]);

 sheet.getRange(2, 1, results.getRows().length, headerNames.length)
      .setValues(results.getRows());

  var secondaryHeaderNames = [];
  for (var i = 0, header; header = secondaryResults.getColumnHeaders()[i]; ++i) {
    secondaryHeaderNames.push(header.getName());
  }
  sheet.getRange(1, (headerNames.length+1), 1, secondaryHeaderNames.length)
      .setValues([secondaryHeaderNames]);
  sheet.getRange(2, (headerNames.length+1), results.getRows().length, secondaryHeaderNames.length)
      .setValues(secondaryResults.getRows());

  // So now we have redundant data in columns D and E (ga:date is in A and D, ga:sessions is in B and E)
  // As a workaround, we will delete those two redundant columns.
  sheet.deleteColumns(4, 2);
  // Now, column D is the Monthly Active Users.

  // Finally, we need to calculate the DAU/MAU ratio in column E.
  // Set the title for column E:
  sheet.getRange(1,5,1,1).setValue("DAU/MAU ratio");
  for (var i = 2; i<(secondaryResults.getRows().length+2); ++i) {
if (sheet.getRange(i,4,1,1).getValue() !== 0) {
value = sheet.getRange(i,3,1,1).getValue()/sheet.getRange(i,4,1,1).getValue();
    } else {
      value = 0;
    }
    sheet.getRange(i,5,1,1).setValue(value);
  }
}

Once you save the script you should do a test run. Select the pullData function using the function picker and run it. Once you’ve started running it, switch to your browser tab with Google Sheets – if there are any errors they’ll appear here. If there aren’t any errors and the script executes properly, you should see the spreadsheet filled out with stats on the daily and monthly active users, plus the DAU/MAU ratio.

With a working script, the automation of this report is close to done – what remains with this script is a scheduled daily script execution. Use the scheduler to set the script to run once per day. Presumably you’ll want to schedule it to run sometime before your working hours, so that the report’s updated before you might need to check it.

IV. CONNECTING GOOGLE SHEETS TO GOOGLE DATA STUDIO
You’ve got a spreadsheet that shows the last 56 days of DAU/MAU stats (2 28-day periods) and the spreadsheet updates itself daily. This spreadsheet is now ready to get connected to your report in Google Data Studio. Switch back to Google Data Studio, add a new data source via "Manage added data sources", select the Google Sheets option, and find your document and the specific spreadsheet you’re updating. When you set up the connection, you’ll see all the data which is coming in. This should be a Date dimension, a ga:1dayUsers metric, a ga:28dayUsers metric, and a DAU/MAU ratio metric. Set the DAU/MAU ratio metric from “Number” to “Percent” and add the data source.

With the new data source added, you can create a time chart for the DAU/MAU ratio and create number metrics for average DAU, average MAU, and average ratio if you want those.
V. POSSIBLE EXPANSIONS ON THIS WORK
Some areas that might be good for further exploration:
Repeat this process using Daily Active User and Weekly Active User stats instead of Daily/Monthly
Pull more data into the spreadsheet to compare quarters or years instead of months
Segment the DAU and MAU data on desktop user vs. mobile user to compare which channel is stickiest (the script allows you to include a segment in the optArgs variable like this: 'segment': 'dynamic::ga:isMobile==Yes')